Apple’s extraordinary rise from a 1976 garage startup to a multi-trillion-dollar global brand highlights the power of design, integration, and platform thinking. This comprehensive feature explores Apple’s founding, the Macintosh revolution, the iPhone era, the Services ecosystem, financial milestones, and what the future holds for the company in AI, mixed reality, and sustainability.
Table of Contents
- 1. Introduction: Apple’s Rise from a Silicon Valley Garage
- 2. The Founding Years: 1976–1984
- 3. The Macintosh Revolution
- 4. Steve Jobs’ Return and the Second Act (1997–2005)
- 5. The iPhone Era & Mobile Transformation (2007–2015)
- 6. Services, Ecosystem & Device-Installed Base (2015–2025)
- 7. The Trillion-Dollar Milestone (2018–2025)
- 8. Apple by the Numbers (Tables & Charts)
- 9. Stock Performance & Market Value
- 10. Apple’s Strategic Acquisitions
- 11. The Future: AI, Mixed Reality & Sustainability
- 12. Final Thoughts
- 13. FAQ
1. Introduction: Apple’s Rise from a Silicon Valley Garage
Founded on April 1, 1976 by Steve Jobs, Steve Wozniak, and Ronald Wayne, Apple Inc. began in a modest California garage. The founders’ vision was simple — to make technology personal.
Today, Apple is the world’s most valuable brand, with over 2.3 billion active devices and a valuation exceeding $2.7 trillion (2025).
2. The Founding Years: 1976–1984
| Year | Milestone | Notes |
|---|---|---|
| 1976 | Apple I launched | Sold as a motherboard kit for $666.66 |
| 1977 | Apple II introduced | One of the first successful mass-market PCs |
| 1980 | IPO at $22/share | Valued at $1.8 billion; raised $100 million |
| 1983 | Lisa computer released | Early GUI; commercially limited |
| 1984 | Macintosh launched | Iconic “1984” Super Bowl ad; GUI revolution |
Revenue growth: $774 K (1977) → $117 M (1980), a 533 % CAGR.
3. The Macintosh Revolution
In 1984, Apple debuted the Macintosh, bringing graphical interfaces and the mouse to the mainstream. While not an immediate blockbuster, it cemented Apple’s identity as an innovator in design and user experience.
4. Steve Jobs’ Return and the Second Act (1997–2005)
After years of struggle and declining market share, Apple rehired Steve Jobs in 1997.
He simplified the product line and focused on creativity, design, and integration.
Key Highlights
- 1998: Launch of colorful iMac G3, boosting sales.
- 2001: Introduction of the iPod and Mac OS X.
- 2003: iTunes Store transforms the music industry.
- 2005: Transition to Intel chips enhances Mac performance.
Financial Recovery: 1997 Revenue = $7.1 B → 2005 Revenue = $13.9 B; Net Income = $1.3 B.
5. The iPhone Era & Mobile Transformation (2007–2015)
The iPhone, unveiled on June 29 2007, changed consumer electronics forever.
📈 iPhone Sales & Market Share
| Year | Units (M) | Global Share | iPhone Revenue ($B) |
|---|---|---|---|
| 2007 | 1.4 | 3 % | 0.6 |
| 2010 | 39 | 15 % | 25.1 |
| 2013 | 150 | 15 % | 91.3 |
| 2015 | 231 | 16 % | 155.0 |
• 2015 global smartphone sales = 1.42 B units (Gartner) → Apple ≈ 16 % share but captured 92 % of industry profit.
• Gross margin averaged ~39 % during this era.
• By 2015, cash reserves exceeded $200 B.
Impact: iPhone redefined photography, payments, software, and design.
6. Services, Ecosystem & Device-Installed Base (2015–2025)
📱 Installed Device Base
| Year | Active Devices (B Units) | Growth YoY |
|---|---|---|
| 2015 | 1.0 | — |
| 2020 | 1.5 | +50 % |
| 2024 | 2.2 | +6.5 % |
| 2025 | 2.35 | +6.8 % |
💰 Services Revenue Growth
| Year | Services ($B) | % of Total Revenue | Key Drivers |
|---|---|---|---|
| 2015 | 19.9 | 8 % | iCloud, iTunes |
| 2020 | 53.8 | 20 % | App Store, Apple Music |
| 2024 | 96.0 | 25 % | TV+, Pay, iCloud+ |
| 2025 (est.) | 110 | 27 % | AI-enhanced services |
• Services gross margin ≈ 71 % (vs 37 % for hardware). • Apple Pay users = 550 M (2024). • App Store ecosystem transactions > $1.1 T (2024).
🌍 iOS vs Android Market Share
| Year | iOS Share | Android Share | Premium Segment (>$800) |
|---|---|---|---|
| 2015 | 16 % | 82 % | ~60 % |
| 2020 | 24 % | 75 % | ~70 % |
| 2024 | 28.5 % | 70.7 % | ~75 % |
| 2025 | 26 % | 73 % | ~72 % |
7. The Trillion-Dollar Milestone (2018–2025)
Apple reached historic valuation milestones:
| Year | Market Cap ($T) | Revenue ($B) | Net Income ($B) |
|---|---|---|---|
| 2018 | 1.0 | 265 | 59.5 |
| 2020 | 2.0 | 274 | 57.4 |
| 2024 | 2.6 | 383 | 97.0 |
| 2025 (est.) | 2.7 | 405 | 102.0 |
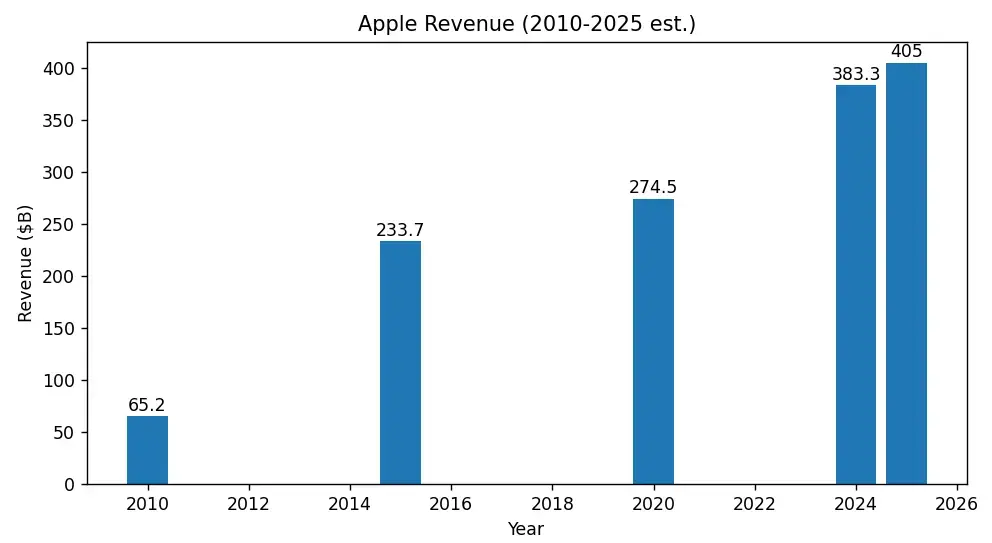
8. Apple by the Numbers
| Metric | 2010 | 2015 | 2020 | 2025 (est.) |
|---|---|---|---|---|
| Revenue ($B) | 65.2 | 233.7 | 274.5 | 405 |
| Net Income ($B) | 14.0 | 53.4 | 57.4 | 102 |
| Employees | 47 K | 110 K | 147 K | 210 K |
| Market Cap ($T) | 0.35 | 0.7 | 2.0 | 2.7 |
9. Stock Performance & Market Value
| Year | Split-Adjusted Share Price | Gain Since IPO |
|---|---|---|
| 1980 | $0.10 | — |
| 2000 | $1.00 | +900 % |
| 2010 | $8.00 | +7,900 % |
| 2020 | $132.00 | +131,900 % |
| 2025 | $220.00 | +219,000 % |
Buybacks (2012–2025): > $650 B • Dividend Yield (2025): 0.55 %
10. Apple’s Strategic Acquisitions
| Year | Company | Value ($B) | Purpose |
|---|---|---|---|
| 2014 | Beats Electronics | 3.0 | Music & headphones |
| 2016 | Turi | 0.2 | Machine Learning |
| 2018 | Shazam | 0.4 | AI & music recognition |
| 2020 | Xnor.ai | 0.1 | Edge AI |
| 2023 | Mira AR | Undisclosed | AR hardware for Vision Pro |
11. The Future: AI, Mixed Reality & Sustainability
- Generative AI: On-device AI models; next-gen Siri and Vision OS integrations (2025–26).
- Spatial Computing: Vision Pro (2024) defines Apple’s AR/VR ecosystem.
- Automotive: Apple Car & autonomous systems in research phase.
- Fintech: Apple Card and Pay Later extend into consumer finance.
- Sustainability: Entire supply chain carbon neutral by 2030.
12. Final Thoughts
From a garage in Cupertino to a multi-trillion-dollar empire, Apple has transformed industries through vision, design, and discipline. Its blend of hardware, software and services continues to define the future of personal technology — and for investors, few stories match its scale of success.
13. FAQ
Q1. When was Apple founded?
A1. On April 1, 1976 by Steve Jobs, Steve Wozniak and Ronald Wayne.
Q2. When did Apple launch the first iPhone?
A2. June 29, 2007.
Q3. When did Apple reach $1 trillion valuation?
A3. August 2, 2018.
Q4. What is Apple’s market value in 2025?
A4. Around $2.7 trillion (company & market estimates).
Q5. What drives Apple’s future growth?
A5. AI, services expansion, Vision Pro, and sustainable innovation.
Sources & Further Reading
- Apple Investor Relations — Quarterly & Annual Reports
- Apple — Wikipedia (history & milestones)
- The Verge — Coverage on Apple products (search site)
- Reuters — Apple company news & filings
Note: Figures are compiled from public filings and analyst estimates (2025). For live stock/market data, reference Apple IR or your preferred market-data provider.
Disclaimer: This article is for informational purposes and is not investment advice. Always perform your own due diligence before investing.

Leave a comment
Your email address will not be published. Required fields are marked *